
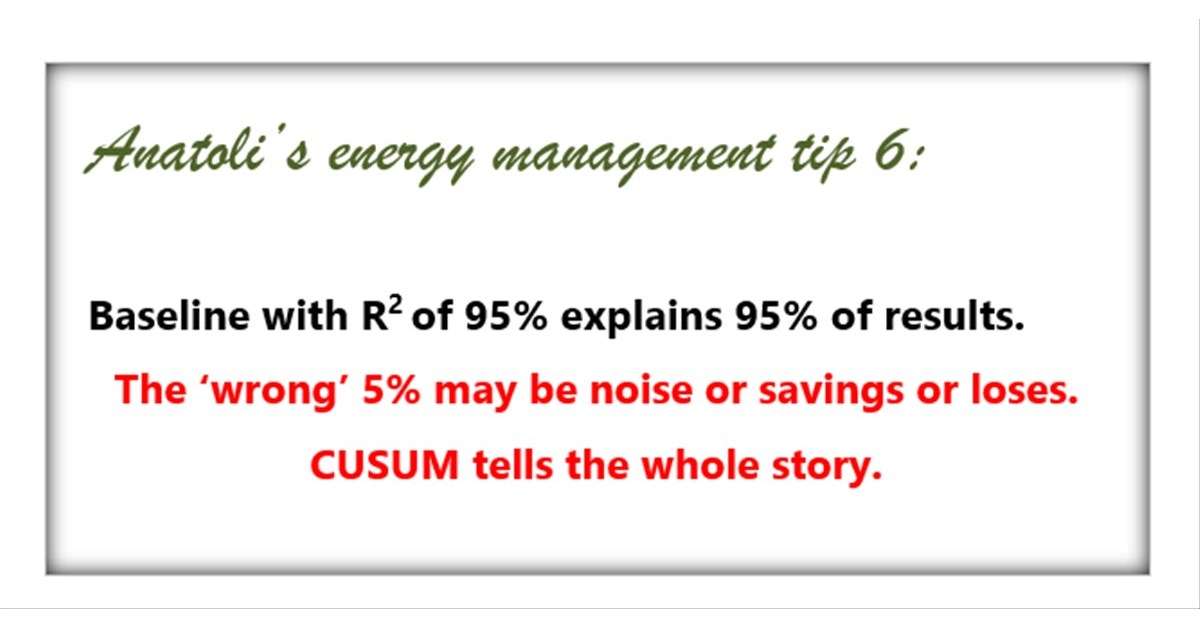
Small deviations from baseline may hide big issues or a big bonus
When a baseline built over a certain period has R2=95%, it means that baseline formula accurately predicts actual consumption in 95% of the time during this period. This does NOT mean that there were no changes during this period. The wrongly predicted 5% of data points may be measurement noise or data collection error or your savings/waste or equipment [...]
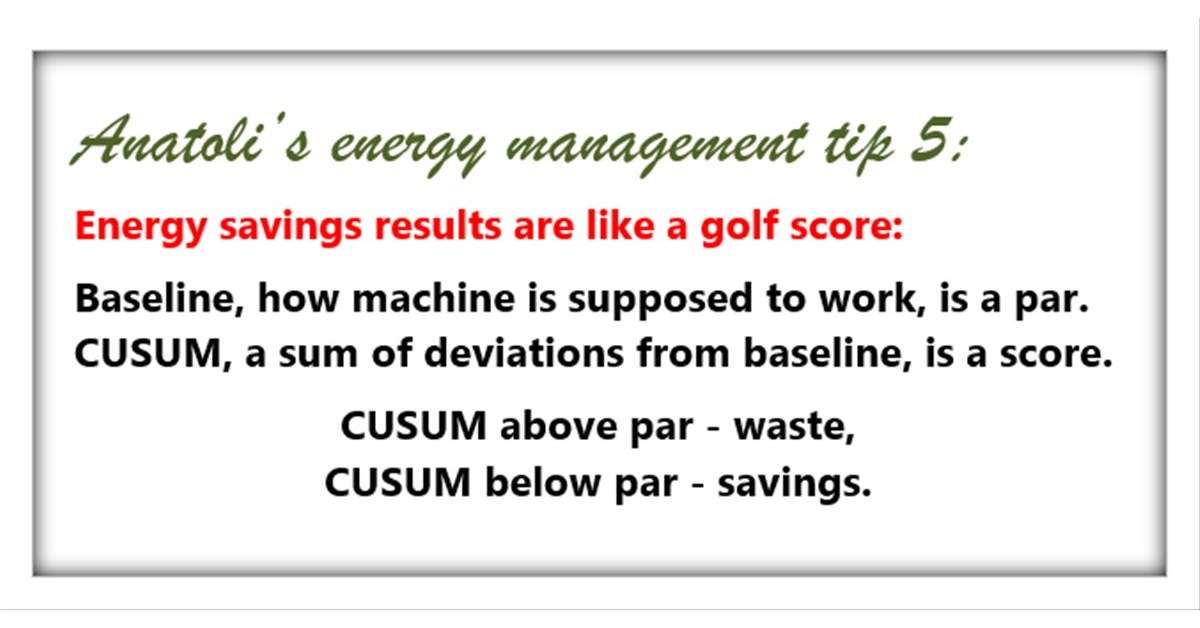
Energy performance is like a golf score
Calculating energy savings results is like keeping a golf score. If you ever been on the green, understanding the meaning of CUSUM will come easy. Baseline - how machine is supposed to work or worked before retrofit - is a par. CUSUM - a cumulative sum of deviations from baseline - is a score. If CUSUM is above par, machine [...]

Energy Efficiency without tears – an energy efficiency encyclopedia – free pdf from the author
I admire professionals who put public good ahead of personal gain. Niall Enright shares his vast practical experience and practical recommendations on finding and implementing a wide range of energy efficiency projects in his book. Free for all. No strings attached. Here is Niall's email with link to download. Dear Anatoli Naoumov, The central role of energy and resource [...]
Use of average energy intensity can hide savings or show fake savings
A common way to determine energy intensity in manufacturing is to divide energy cost by production volume, resulting in kWh per car or m3 per pound of bread. This simplistic approach may hit energy manager where it hurts the most - at evaluation of completed projects. A good well-implemented project may show dismal savings if any savings at all. [...]
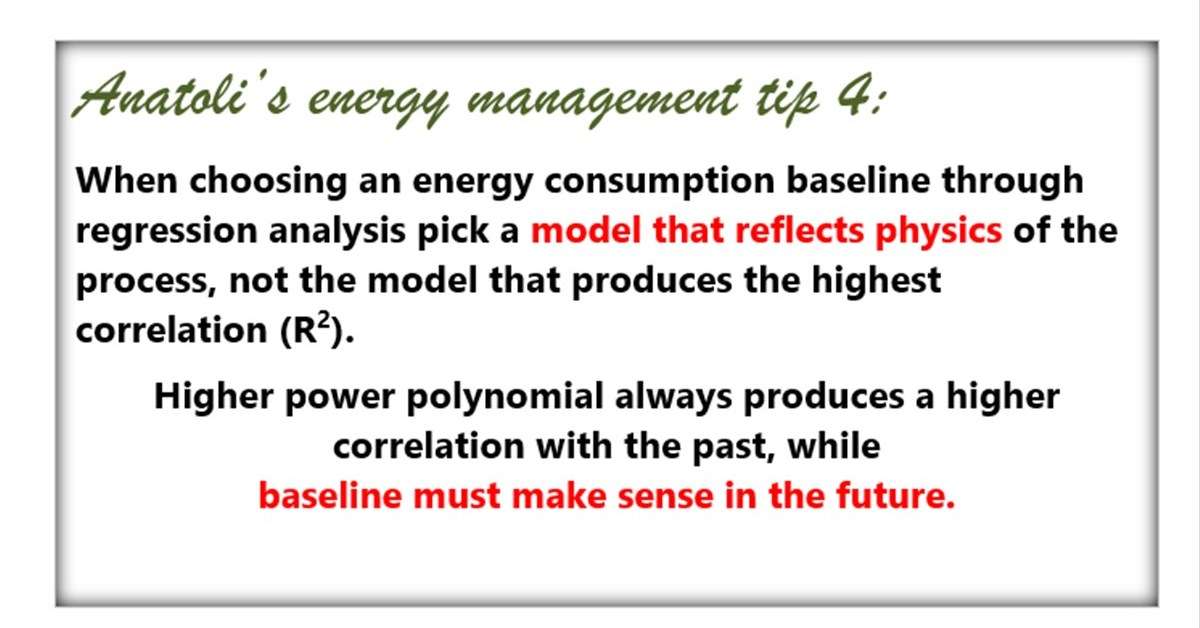
High R2 of baseline model may lead to troubles
When determining energy consumption baseline through regression analysis, as recommended by best practices, sensible energy managers pick a formula that relies of physics of the process, not a formula that produces the highest correlation (R2) between predicted and measured data. In a vast majority of cases relation between energy consumed and it's driver is linear. Here are several examples [...]
Use of average cost per kWh hides savings from CFO
Use of average electricity cost can be misleading when assessing financial impact of energy efficiency measures. What counts is the cost of the last kWh comprised of Global Adjustment (Ontario), demand charges and energy cost. If average cost per kWh is used during project approval, it may become a challenge to show savings to CFO on the bill. [...]

In energy waste prevention time is of the essence
If your plant underproduced today, you may be able to catch up with schedule by working overtime tomorrow. If you wasted energy today, it is gone forever. No effort tomorrow will help to recover it. Timely action is the key to stop waste before it became to big. Do you know how much energy your plant should consume with [...]