
Another email (call, booklet) offers you an energy efficiency measure with a 12 months payback period. Can this be true?
disappointment after implementation manager must understand utility bill structure and tariff options. Use of average cost per kWh may lead to wrong investment decisions. Average cost of kWh makes almost as much sense as average temperature of patients in the hospital. Let’s make a common energy management decision: estimate payback period of a proposed energy efficiency project on an example.
A vendor knocks at the door and offers proven energy efficiency solution that is guaranteed to save 10,000 kWh per month for an initial cost of $25,000. Assuming we have reasons to believe this claim, what is the payback period? A monthly bill averages 12.5c per kWh. Therefore, 10,000 kWh per month is worth $1,250, which brings payback period to 20 months. Correct? It depends.
To estimate payback period on the proposed energy efficiency project let’s first look at the way hydro bill is structured. Electricity bill consists of three parts:
- charge proportional to consumed electricity (kWh),
- charge proportional to max achieved demand through billing period (kW; for simplicity we will ignore the difference between kW and KVA)
- fixed charge.
For this example we shall use rates charged by Toronto Hydro, with some simplifications that do not affect the final conclusion. Rates charged for electricity service depend on the scale of electricity consumption:
Regulatory and debt retiring charges add 1.27c to electricity rate. Other utilities may have a different rate structure.
Right away we can notice a flaw of using average cost per kWh as a tool to assess profitability of energy saving project: fixed charge will not go away from any energy efficiency measure. Also, for small commercial clients value of energy savings may depend on the time when the saving actually happens. For bigger companies value of energy savings depend on the scale of their consumption. But this is only the beginning. The key to assessing realistic payback is finding out if the proposed energy saving measure decreases the peak demand.
Some energy efficiency measure decrease the peak demand, some – consumption of electricity, some do both. With the same saved energy such measures will have rather different payback period. Financial value of saved 10,000 kWh is $1,137 for mid-size company and $1,505 for a small one. If the same measure also shaves 25kW from peak demand, it will save $267 to mid-size company and nothing to a small one. Therefore, if this project saves consumption and demand its payback period at mid-size Toronto Hydro client will be under 18 months. If it does not shave demand, then the same company will see payback period of 22 months. A small company with the same savings will see a payback period of 16.6 months.
In conclusion, several examples of common energy efficiency measures and their saving factors:
| Energy efficiency measure | What it saves |
| Lighting retrofit | Demand and consumption |
| Lighting controls | Consumption only |
| VFD on old motors | Consumption only |
| Efficient motor | Demand and consumption |
| Load shifting | Demand only |
| AC upgrade | Demand and consumption |
| AC controls | Consumption only |
| Window shading on its own | Consumption only |
| Window shading followed by AC de-rating | Demand and consumption |
Using less energy leads to lower utility bill. Using more energy can reduce the bill too. We will talk about this in one of the next articles.
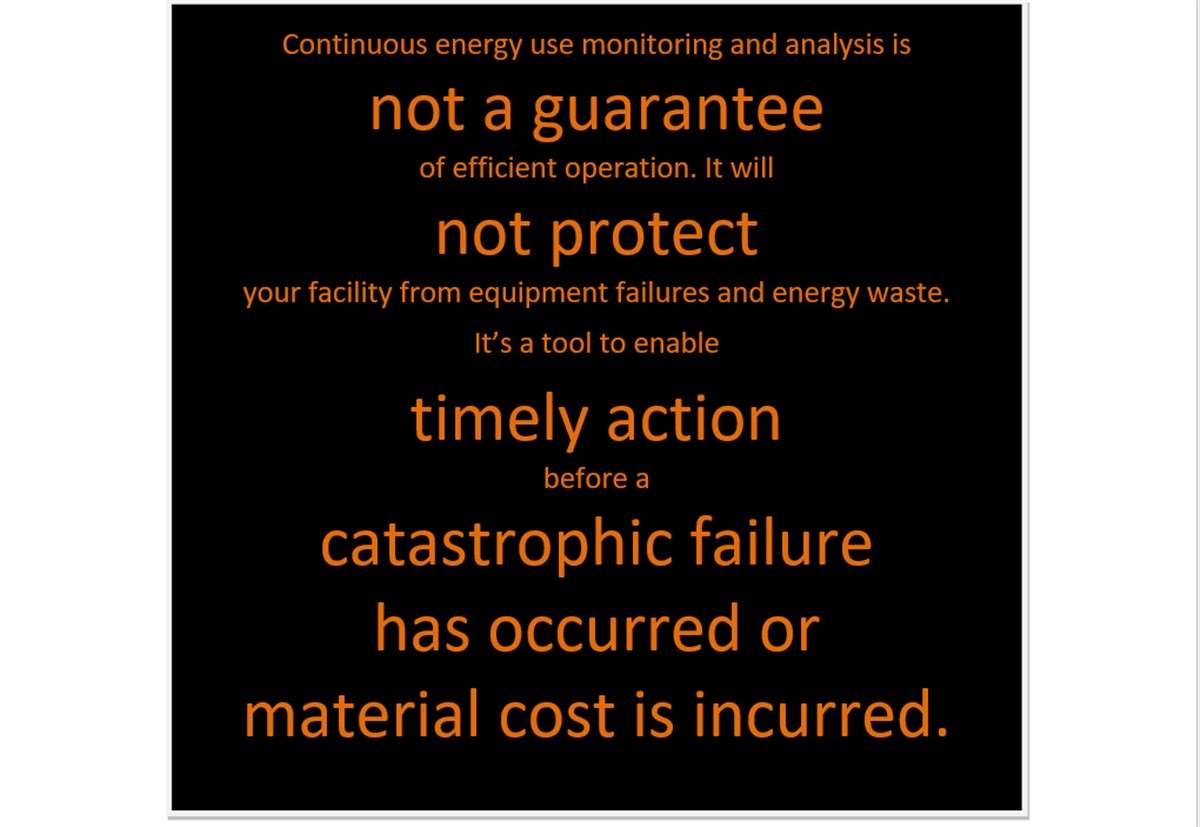
To estimate the payback period of a proposed energy efficiency project properly companies have to consider many factors. Actual savings can only be determined through proper measurement performed “before” and “after” followed by diligent analysis of obtained data.

[…] Previous How much energy do we save with this energy efficiency device? A proper answer to this seemingly simple question is nothing but simple. […]