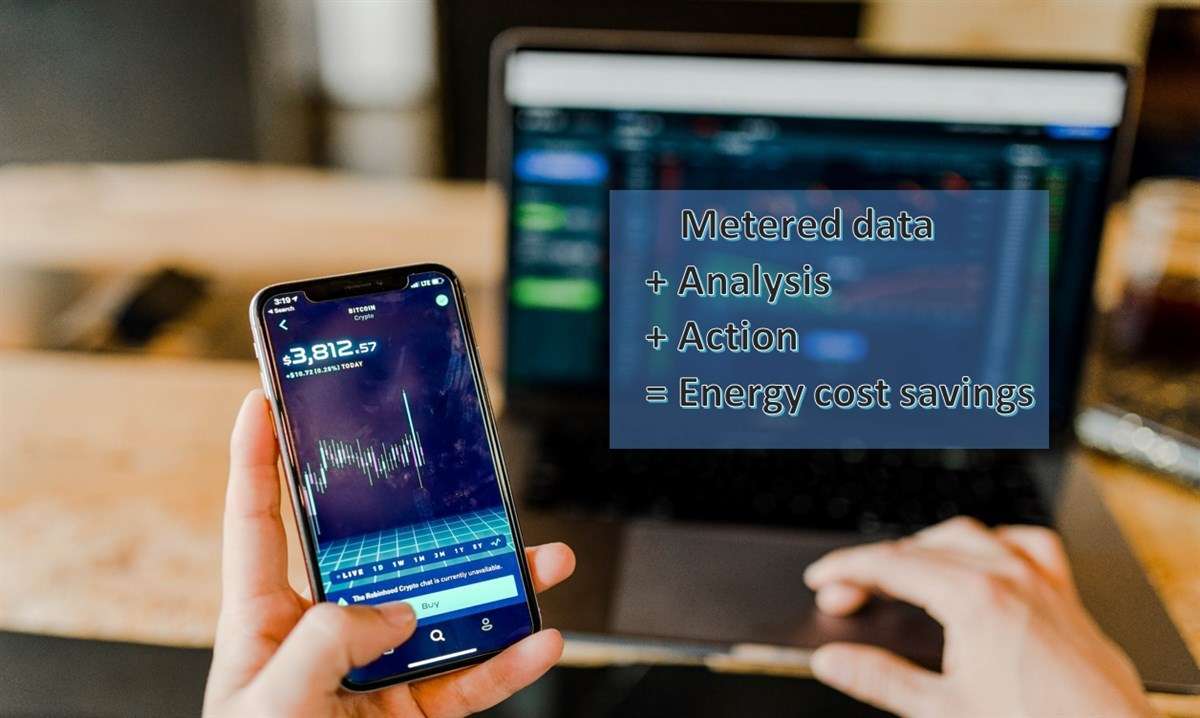
Lots of meters create lots of data. Do they create lots of savings too? Not necessarily.
Megabytes save no megawatts
We came across a manufacturing company where operators processed megabytes of consumption data into $/ton ratios for electricity, natural gas and water. These ratios were presented to C-Level monthly and …. nothing else happened: a month-to-month variation of these ratios by 100% caused no action, not even an investigation.
Dashboard is not an analysis
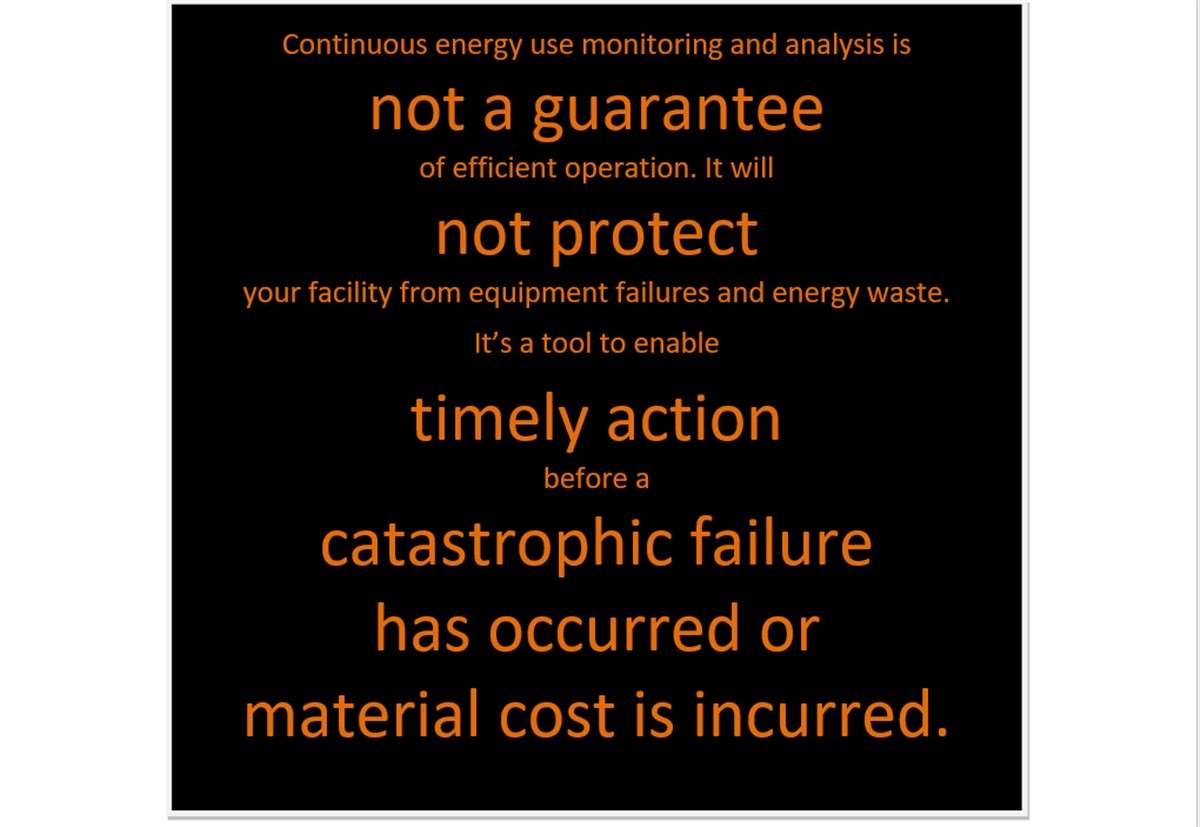
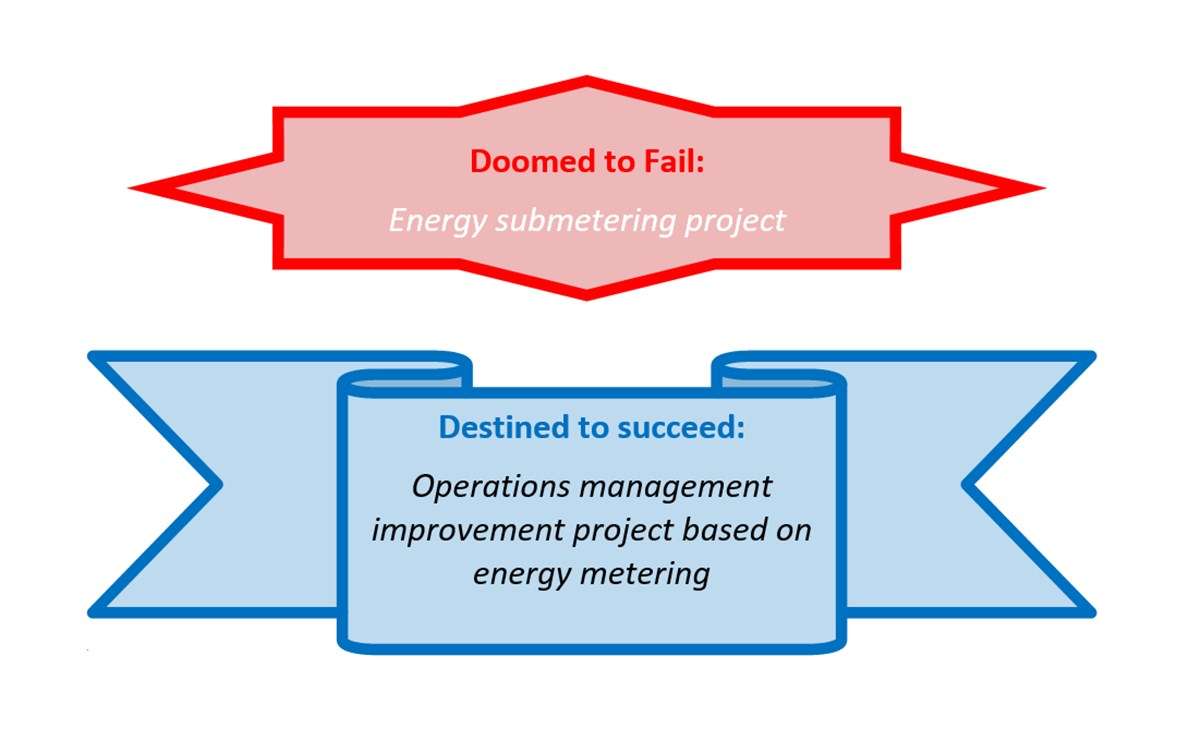
Visibility of energy waste is not created by a possibility to draw a graph. Novelty will quickly diminish with time. Energy use submetering by itself is useless. Analysis and action save costs.
Dashboard without analysis creates a false sense of security. More harm than value.
If data is not processed into actionable information, it’s just a digital dust and maintenance cost.
It’s possible that maintenance manager will keep checking numbers and graphs day after day, hour after hour. Analyse and take action. It’s possible, but highly unlikely.
Without intelligent analysis manager can’t possibly forecast how much energy a well-adjusted company should consume, and without this knowledge setting targets becomes an exercise in report-making.
How to make energy information work
Regression analysis of energy consumption data in relation to its key driving factors opens up a new level of energy management – an intelligence-based targeting. What’s more, understanding what drives energy use empowers energy manager to put his/her efforts where ROI is the highest.
Automatic data collection, purposeful analysis and alert on deviations to appropriate people is a key to sustained energy cost savings.
On the positive side, monitoring of energy consumption at our refrigeration plant optimization project has uncovered massive saving opportunities AND helped maintenance team spot hidden failures before they caused a bottleneck to production.
Read more on the topic: Submetering, EMIS and Energy Management System: what is the difference?

Leave A Comment