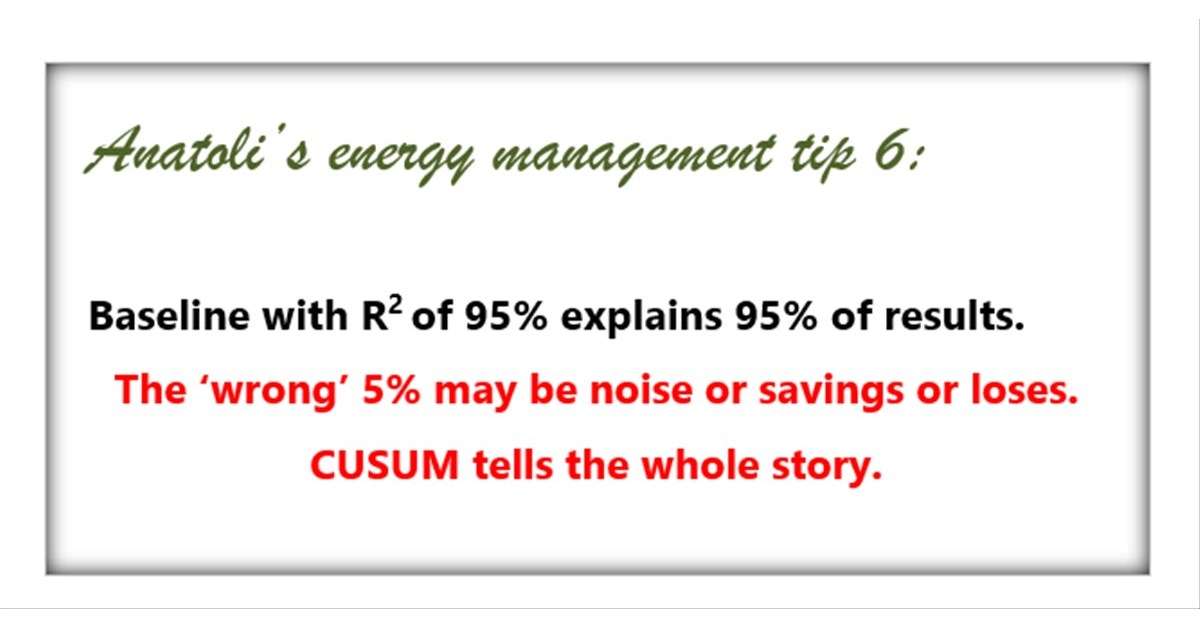
When a baseline built over a certain period has R2=95%, it means that baseline formula accurately predicts actual consumption in 95% of the time during this period. This does NOT mean that there were no changes during this period.
The wrongly predicted 5% of data points may be measurement noise or data collection error or your savings/waste or equipment misuse or malfunction.
Are deviations from prediction spread randomly through the period or happen during particular subperiods? Nights or weekends? Particular shifts?
Do deviations cancel each other or tend to stay above or below prediction? Do deviations grow over time or subside?
CUSUM – a cumulative sum of differences between predicted and measured – tells the whole story.


Leave A Comment